Two ways to detect memory leaks via UI tests
XCTMemoryMetric vs xctrace record
🧭 How I got here
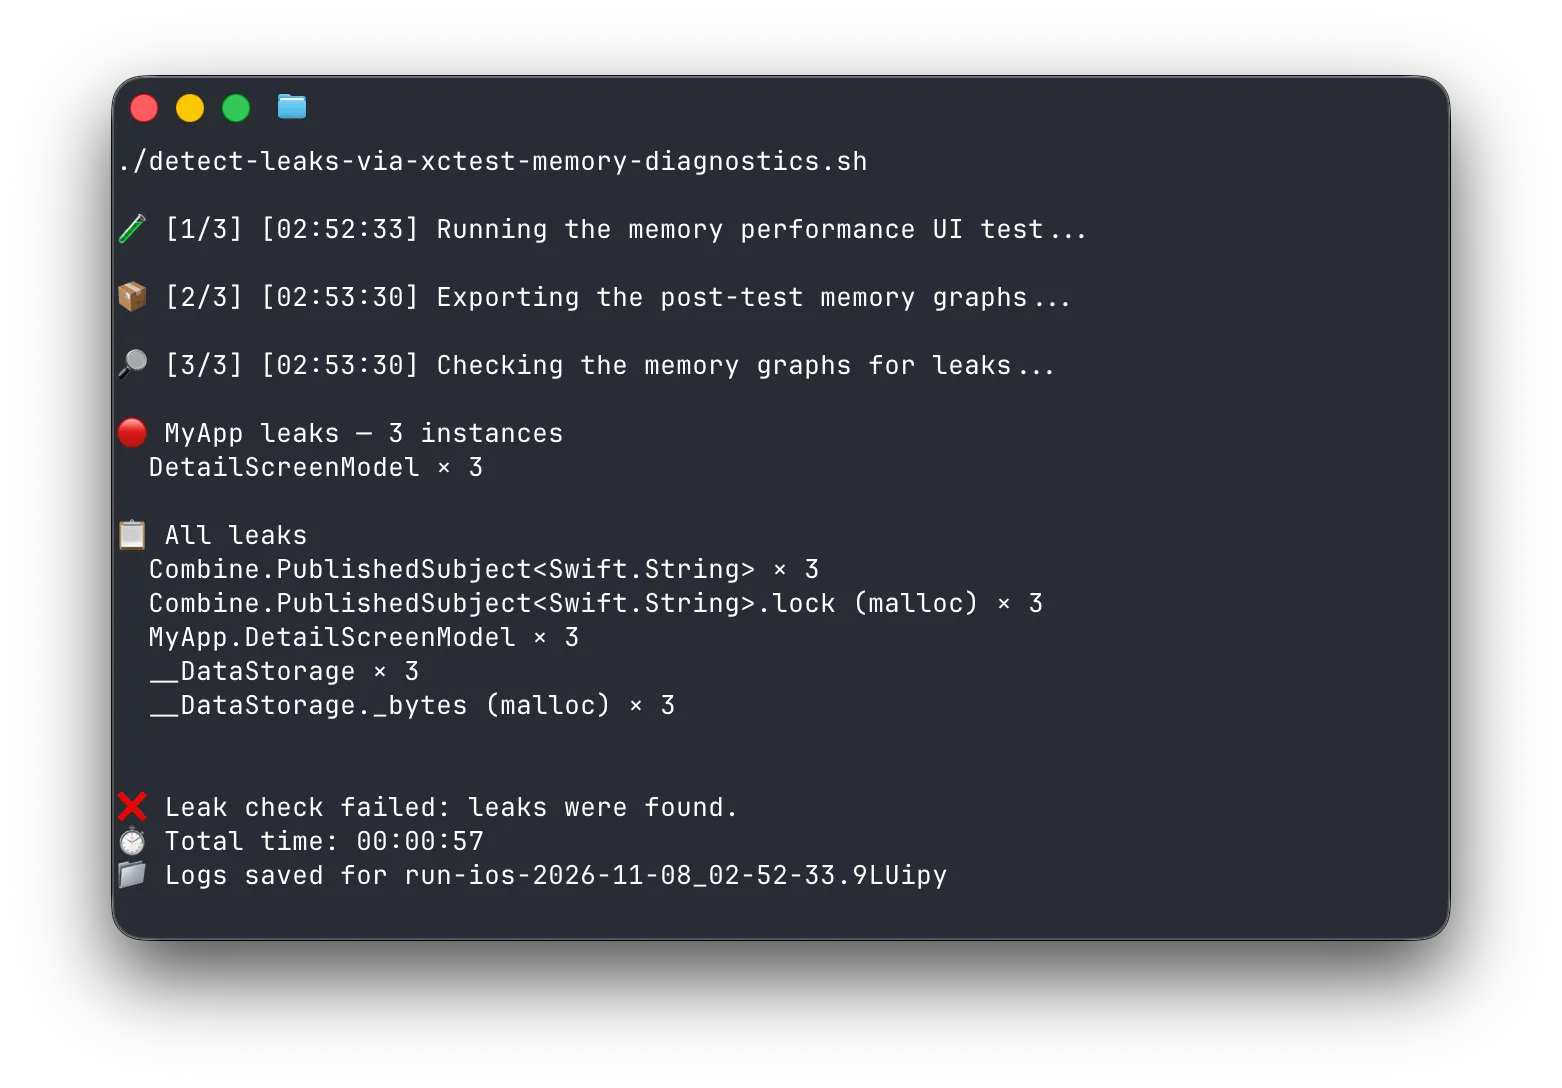
I wanted to revisit my 2019 approach to checking for leaks with UI tests. This time, I used xctrace to record the app with Instruments and export the detected leaks. It worked, but attaching the recorder and processing its output took some setup.
Then I found Pol Piella’s article about XCTMemoryMetric. It offered a simpler route: run the UI test, collect a memory graph, and check it for leaks.
The difference in artifact size surprised me. In my test, the memory graph was about 8 MB, compared with about 300 MB for a 40-second Instruments recording.
Below, I try both approaches + video included. I would start with XCTMemoryMetric for automated checks and keep xctrace for investigations where the recording is useful.
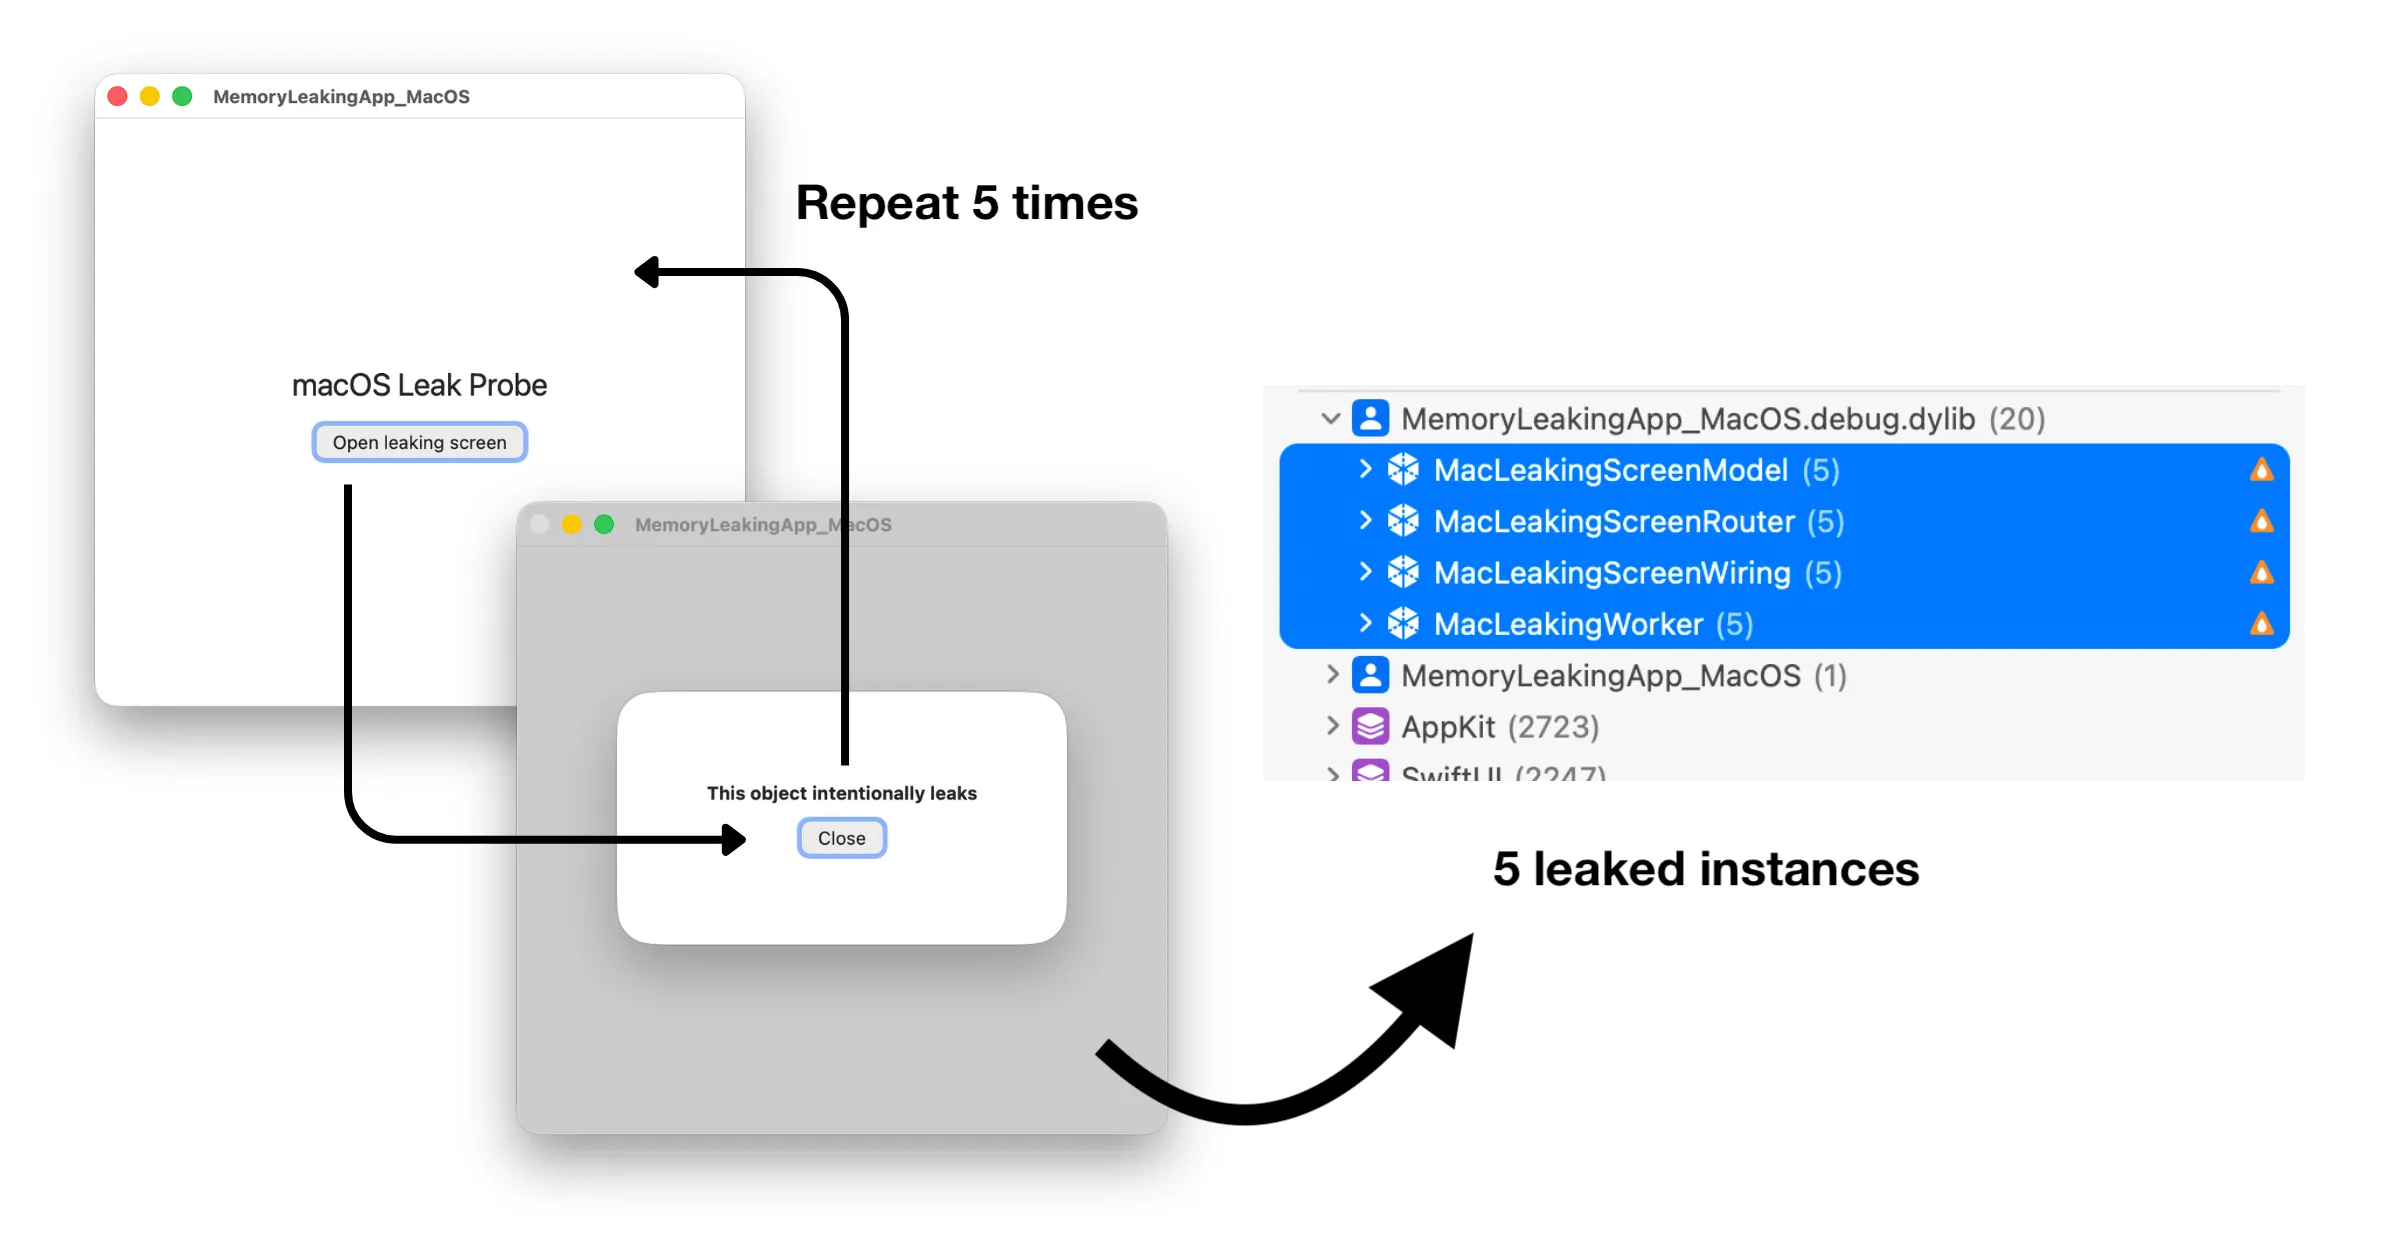
🔍 How to spot a leak
- Three times open and close the screen
- Check Xcode’s “Debug Memory Graph”
- If we see three instances screen objects in memory, then we have leak
📍 Where to check for leaks
- UI tests … best, cover real flows, real wiring, more leaks to catch
- Unit tests … good, cover isolated flows
- swizzling/in-app helpers … ok for debugging, requires marking each type we want to check. So if we want more types, it means more boilerplate, and we could still miss important hotspots visile only when real app wire together multiple components.
🛠️ Two ways to collect memory diagnostics
Lightweight choice
🟡 XCTMemoryMetric
Flow
- run UI/unit test
- →
XCTMemoryMetric - →
.xcresult - →
.memgraph - →
/usr/bin/leaksorheap - → txt list of leaks
Good
- show leaks
.memgraphis small
(~8MB for 40sec recording)
Bad
- runs longer than expected, because XCTest triggers performance test twice (so in total 6 opens of screen)
When I need a full recording
🟣 xctrace with the Leaks instrument
Flow
- run UI/unit test
- → find app PID
- →
xctrace recordLeaks instrument - →
.trace - →
xcrun xctrace export - → xml list of leaks
Good
- shows leaks
- shows timeline of when leak appeared
Bad
.tracevery large
(~300MB for 40sec recording)- need to hook on app process PID at the right time = fragile
🟡 1. XCTMemoryMetric
🟡 1A) Write test
It should repeat flow - open and close screen three times
@MainActor
func testRepeatedFlowWithXCTestMemoryDiagnostics() {
    let app = XCUIApplication()
    let options = XCTMeasureOptions()
    options.iterationCount = 0 // Despite this, test will always run twice (so opening screen 6 times = 2x3)
    options.invocationOptions = [.manuallyStart]

    measure(metrics: [XCTMemoryMetric(application: app)], options: options) {
        app.launch()
        startMeasuring()

        for iteration in 1...3 {
            app.openDetailScreen()
            app.closeDetailScreen()
        }
    }
}
🟡 1B) Run test
⚠️ Use a physical iPhone and run with -enablePerformanceTestsDiagnostics YES to collect the memory graphs.
xcodebuild test \
  -project MyApp.xcodeproj \
  -scheme MyApp \
  -destination 'platform=iOS,id=DEVICE_ID' \
  -only-testing:MyAppUITests/MyAppUITests/testRepeatedFlowWithXCTestMemoryDiagnostics \
  -enablePerformanceTestsDiagnostics YES \
  -resultBundlePath MemoryDiagnostics.xcresult
🟡 1C) Extract memorygraph and leaks
Use xcresulttool export attachments to export .memorygraph files.
On extracted .memgraph you can use:
/usr/bin/leaks… “which allocations look leaked”, good for automatic leak check/usr/bin/heap… “which objects are still around after the flow”, could give signal to investigate more if count is growing
pre="/path/to/pre_MyApp.memgraph"
post="/path/to/post_MyApp.memgraph"
heap --diffFrom="$pre" "$post"
leaks --nostacks --diffFrom="$pre" "$post" > new-leaks.txt
🟡 Example
🟣 2. xctrace record
🟣 2A) Give time for xctrace to attach
The UI test has the same repeated flow. Just with extra pauses each end.
@MainActor
func testRepeatedFlowForInstrumentsAndXctrace() {
    let app = XCUIApplication()
    app.launch()

    Thread.sleep(forTimeInterval: 3)

    for iteration in 1...3 {
        app.openDetailScreen()
        app.closeDetailScreen()
    }

    Thread.sleep(forTimeInterval: 5)
}
🟣 2B) Find the process and record it
xcrun xctrace record \
  --template 'Leaks' \
  --device "$DEVICE_ID" \
  --attach "$APP_PID" \
  --time-limit 45s \
  --output LeakRun.trace \
  --no-prompt
🟣 2C) Export the Leaks table
xcrun xctrace export \
  --input LeakRun.trace \
  --xpath '/trace-toc/run[@number="1"]/tracks/track[@name="Leaks"]/details/detail[@name="Leaks"]' \
  --output LeakRun-leaks.xml
The xctrace man page describes the export commands.
🟣 Example
🧪 Try it out
The example project on GitHub contains
- one small iOS app with leak and UI tests
- script using XCTMemoryMetric
- script using xctrace