How to automatically find memory leaks
Find leaks in iOS apps using CI by combining UI tests, Instruments, and trace parsing.
Originally published on tech.showmax.com.
You can detect iOS memory leaks automatically in CI by combining UI tests, Instruments, and .trace parsing. This post shows the setup and the parts that were easy to get wrong.
Recap
Memory leaks are bad
Memory leaks lead to app crashes, slowness, and low energy efficiency. Swift provides useful warnings (like around self in closures), but real code can be more complicated and leaks are still easy to miss.
Common ways to discover leaks
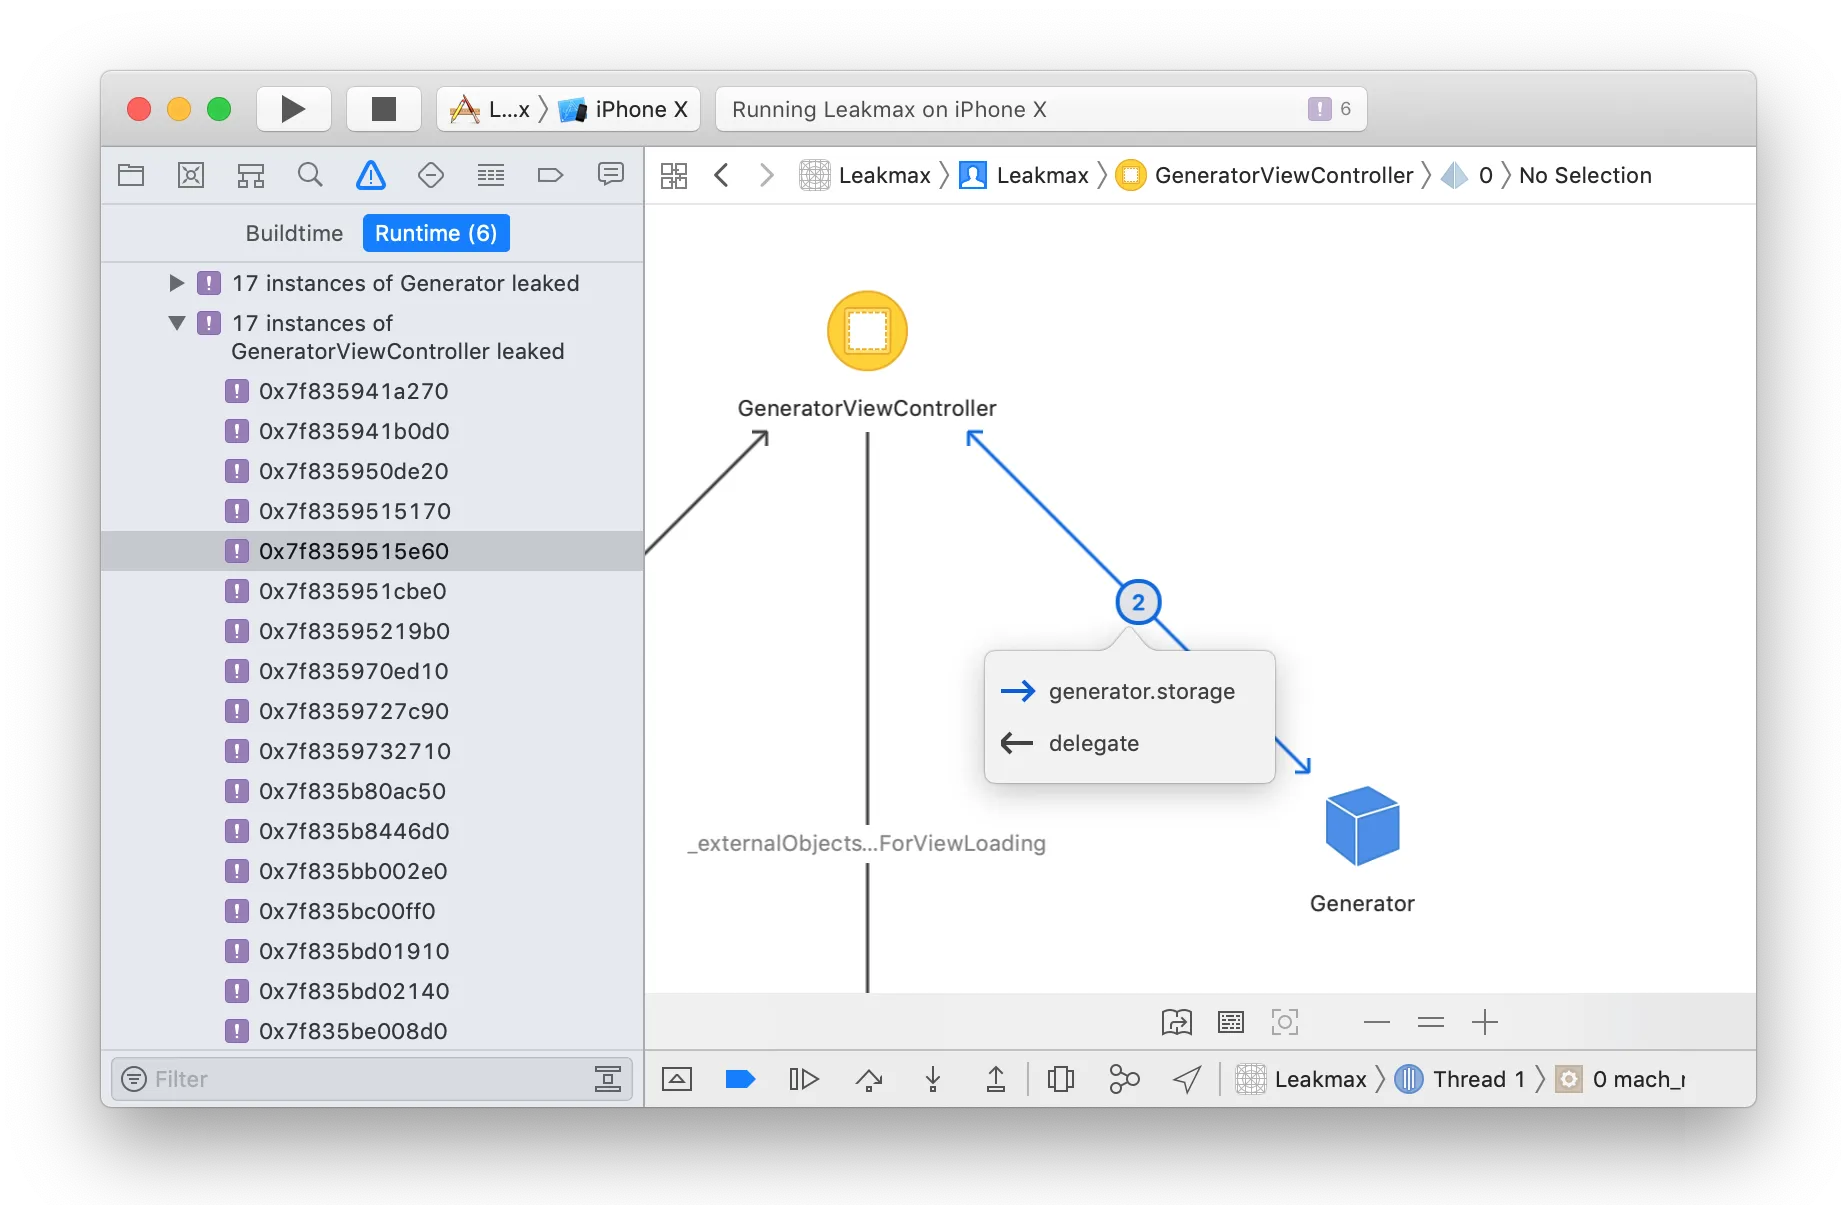
I like to use Memory Graph Debugger when I get suspicious during development or code review - you can pause execution and filter out by keyword all relevant objects in current memory. Instruments needs more setup, but are great for a deeper dive.
Easy trick to spot leak
- Repeat the user flow 5 times
- open + close
SettingsViewController - open + close
SettingsViewController - open + close
SettingsViewController - open + close
SettingsViewController - open + close
SettingsViewController
- open + close
- Open Xcode’s memory graph.
- If you see 5 instances of
SettingsViewController, you likely have a leak.
Why automate leak checks
- Saves developer time: No need to remember to run Instruments manually after every change.
- Catch regressions early: Leaks often appear after small changes, CI surface them immediately.
- Prevents accumulation: Small leaks could pile up into crashes.
- Reuses UI tests → no new test surface needed, just adds profiling + analysis.
How
Our goal was simple:
- run UI scenarios nightly in CI
- record with Instruments
- extract discovered leaks
- and compare with historical runs
After experimenting with UI tests, Instruments, and TraceUtility for reading .trace files, we connected the tools in a shell script that automates leak detection.
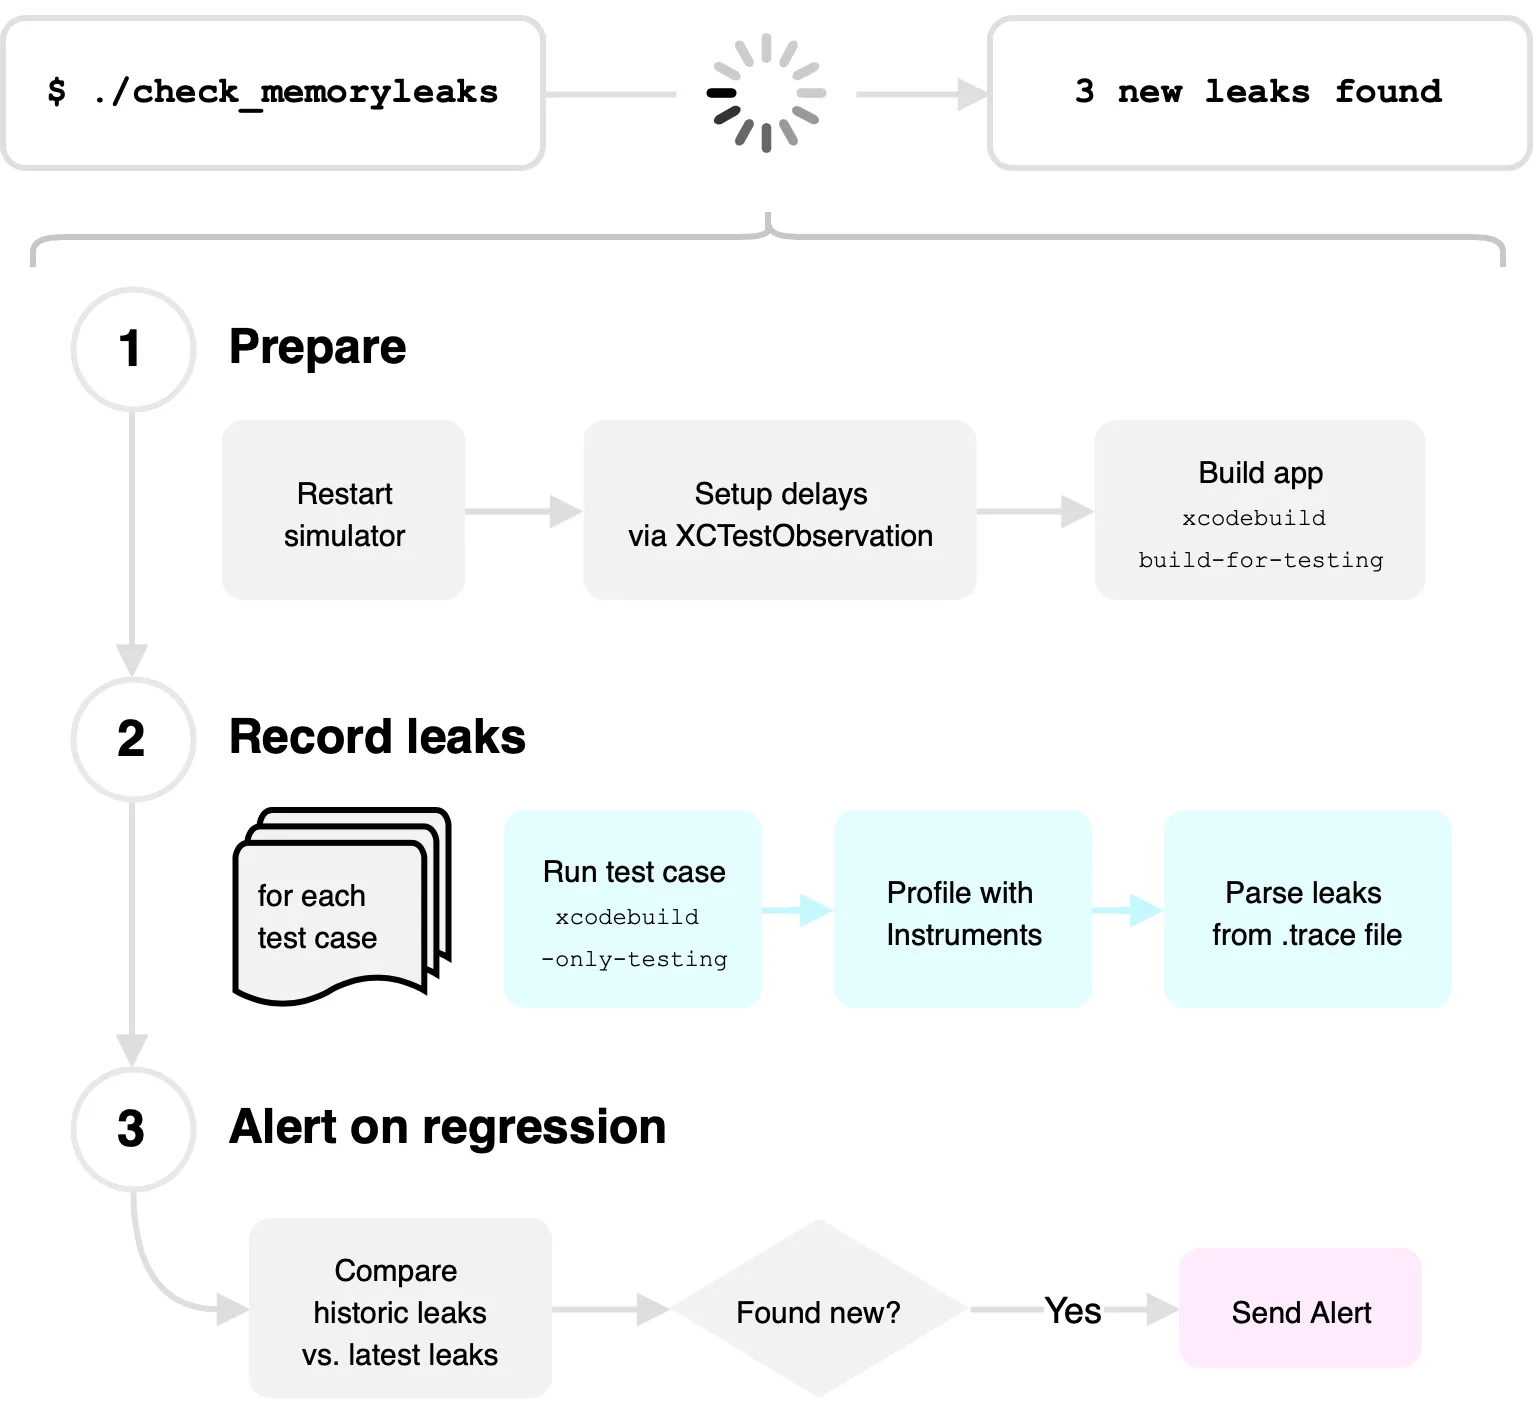
This worked, but not immediately. These were the main obstacles and fixes.
Obstacles
#1: Simulated app usage
- Problem: most leaks appear during real app usage.
- Fix: reuse UI tests to simulate real flows; they were accurate enough for leak detection and already existed for regression coverage.
#2: Attaching the tested app to Instruments
- Problem: direct app-path launch from Instruments CLI did not fit our UI test setup.
- Fix: attach Instruments by process ID, then continue the test run.
- The sequence that worked:
- Start tests in simulator with
xcodebuild test-without-building. - Wait until the app launches, capture its PID, and pause it.
- Start
instruments -p <PID>. - Wait briefly so Instruments can attach fully, then resume the app process.
- Let the test finish and export results to
.trace.
- Start tests in simulator with
#3: Instruments needs delay after tests finish
- Problem: leaks were sometimes missing at the end of the run.
- Fix: add a short post-test delay so Instruments can flush final data, implemented via
NSPrincipalClass+XCTestObservationintestBundleDidFinish.
#4: Instruments hangs for long recording sessions
- Problem: one long recording session caused hangs and huge trace files.
- Fix: profile each test separately with
xcodebuild -only-testing:<TestCaseName>.
#5: Reading leaks from .trace
- Problem:
.tracefiles are large and hard to inspect directly. - Fix: use TraceUtility, with our patch, to export leaks as plist with object names and counts.
This made CI comparisons straightforward: compare latest run vs historical runs and alert when a new leak appears (email, Slack, Kibana, etc.).
Example
Leaking code
Here is a demonstration repo: Showmax/automated-memory-leak-testing-ios.
protocol GeneratorDelegate: AnyObject {
    func didGenerate(number: Int)
}

final class Generator {

    // 💣 Leak due missing `weak`. Strong capture of delegate cause retain cycle.
    var delegate: GeneratorDelegate?

    init(delegate: GeneratorDelegate) {
        self.delegate = delegate
    }

    func generate() {
        let number = Int.random(in: 0..<100)
        DispatchQueue.main.asyncAfter(deadline: .now() + 1.0) {
            self.delegate?.didGenerate(number: number)
        }
    }
}
Visual demo
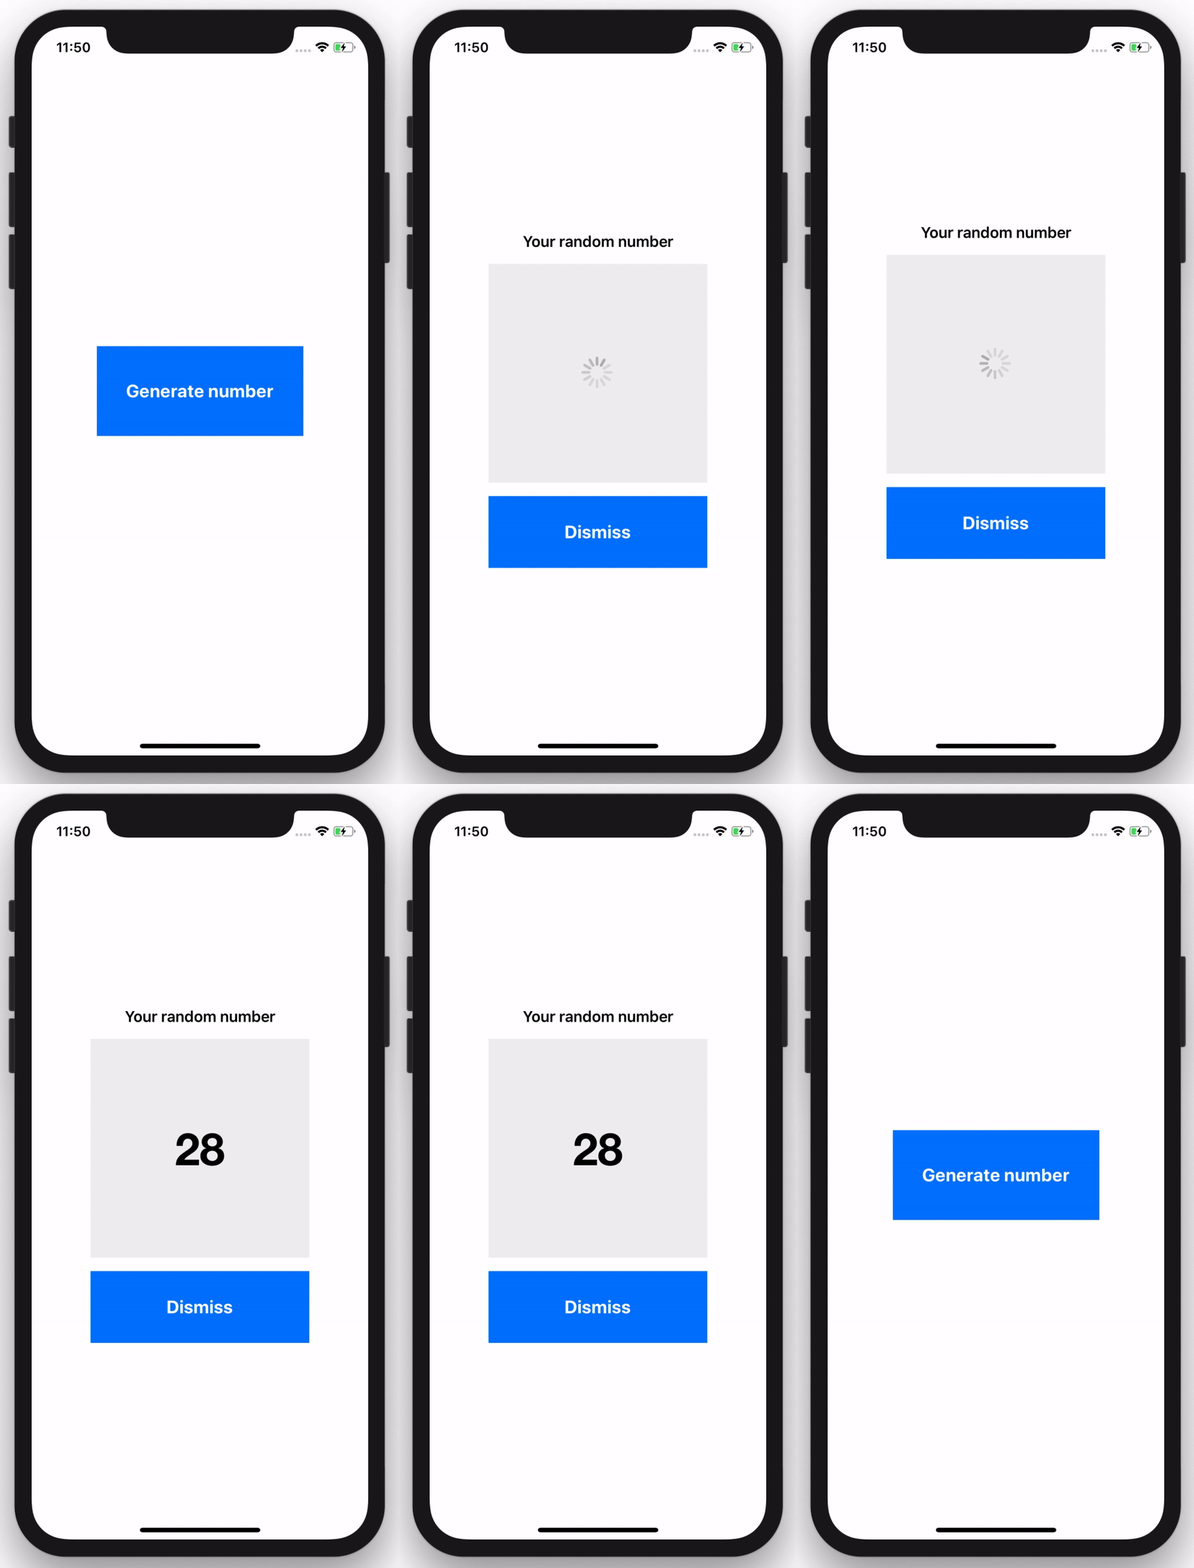
The app has a screen that generates a random number. The screen references Generator, which returns values via a delegate after a delay.
Cycle in this demo: NumberGeneratorViewController -> Generator -> delegate (NumberGeneratorViewController).
Discover leak
Fortunately, we have a UI test that opens the generator screen and checks for leaks:
$ ./check_memoryleaksResult:
Latest leaks:
 2x Malloc 32 Bytes
 1x UINavigationItem  ObjC  UIKitCore
 1x NumberGeneratorViewController  Swift  Leakmax  # <--- our leaking code
 1x CFDictionary  ObjC  CoreFoundation
 1x Malloc 48 Bytes
 1x NumberGenerator  Swift  Leakmax                # <--- our leaking code
 1x UITabBarItem  ObjC  UIKitCore
Known limitations
- Only for simulators. Not tested with real devices.
- Only UI tests. Not tested with unit tests, though the same approach should be adaptable.
You can find the script on GitHub and adapt it for your app.